
Kimball in Real Life: What 6 Months on a Refactored Lakehouse Taught Me
The theory held up. The surprises were somewhere else. Honest lessons from rebuilding business reports on a brand new Kimball model, from grain bugs to reconciling against legacy reports.

Back in April I wrote about data warehousing fundamentals and Kimball dimensional modeling. Facts, dimensions, grain, star schemas. All the textbook stuff.
Then I went quiet for a while. Not because I stopped learning, but because I was learning too much at once.
For the last six months or so, my team has been living inside a refactor. We took an older reporting setup (a mix of a traditional database, a lot of transformation logic hidden inside report-level queries, and some "don't touch this" dataflows) and rebuilt it as a proper Kimball-style warehouse on a lakehouse. Bronze, silver, gold. Clean fact tables. Conformed dimensions. Data coming in from several different source systems.
I was in it end to end. The early deployments, improving our shared framework repo, building ingestion pipelines, and modeling the fact and dimension tables. Later, because I had worked with Power BI before, I also picked up the last mile: rebuilding business reports on top of the new model and making sure the numbers matched the old reports.
That last part sounds simple. It was not.
This post is not a tutorial. It's more like notes I wish someone had handed me on day one. I've kept it generic on purpose, so no company details, but every point here came from something that actually happened.
1. The theory held up. Honestly, better than I expected.
Let me start with the good news, because a lot of "lessons learned" posts are just complaints.
The core Kimball ideas worked. When a report was built on a fact table with a clear grain and proper dimensions, it was faster to build, easier to explain, and much easier to debug than the old version.
A few things I really started appreciating:
- One customer dimension used everywhere. In the old world, "customer" meant slightly different things in different reports. Now there is one place to look. When a business user asks "why is this customer in region X?", there is one answer.
- Surrogate keys. I used to think they were extra work. Then a source system changed its IDs and nothing downstream broke. I'm a fan now.
- Measures in the semantic layer, not in SQL. Keeping the gold tables simple and putting business logic (like "sales last year" or "budget vs actual") in measures made reports much easier to change.
So if you're wondering whether Kimball is "outdated" in the lakehouse era, my answer after six months is no. The storage changed. The modeling thinking didn't need to.
The surprises were somewhere else.
2. "Matching the legacy report" is a much bigger job than it sounds
Every rebuilt report had the same acceptance test: does it match the old one?
On paper, that's fair. The business trusts the old numbers. If the new numbers are different, they won't trust the new platform.
In practice, I learned three things.
The legacy report is not always right. A few times we found a difference, dug in for hours, and realised the old report had a bug that had been there for years. A filter that dropped some rows, or a join that counted something twice. Now you have an awkward conversation: "the new number is different, and the new number is correct." You need proof for that, not just confidence.
The legacy logic is often hidden. Old reports had business rules buried inside report queries, calculated columns, or one-off transformation steps. Nobody documented them because nobody remembered adding them. Rebuilding a report meant doing a bit of archaeology first.
"Close enough" needs a definition. Is a 0.01% difference fine? What about a 2% difference on one product line that cancels out at total level? We had to agree upfront on what "matching" means, or we'd chase decimals forever.
What I do now before touching any report:
- Write down every filter, rule and exception the old report applies, even the weird ones.
- Agree with the business user on what "matching" means for this report.
- Accept that some differences will be explained rather than fixed, and write those explanations down.
3. Grain is where almost every bug lived
If I had to pick one word from the Kimball book that saved me the most time, it's grain.
Grain means: what does one row in this table represent? One order line? One invoice? One customer per month?
Almost every reconciliation problem I hit came down to a grain mismatch somewhere. A few patterns kept repeating.
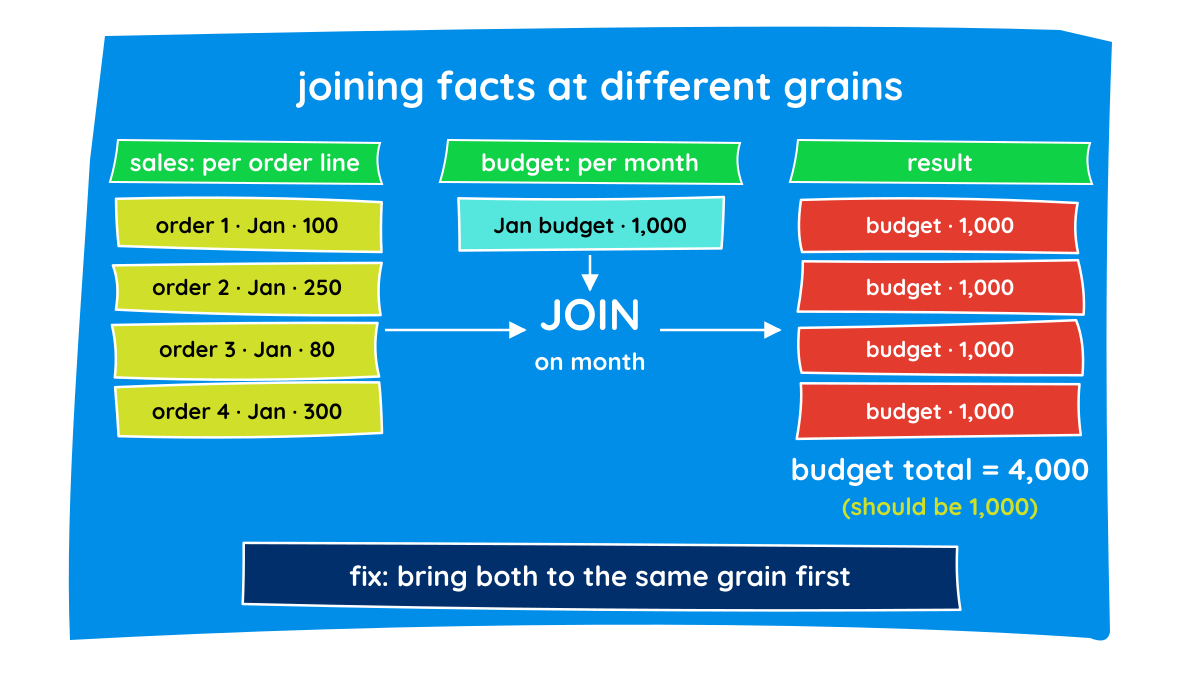
Joining two facts at different grains. Say you have sales at order-line level and budget at product-per-month level. Join them directly and the budget gets repeated for every order line. Your budget total is suddenly 40 times bigger than it should be. Nothing errors out. The number is just quietly wrong.
-- Looks harmless. Isn't.
SELECT
    s.product_key,
    SUM(s.sales_amount)  AS sales,
    SUM(b.budget_amount) AS budget   -- budget is repeated for every sales row
FROM fct_sales s
JOIN fct_budget b
  ON s.product_key = b.product_key
 AND s.month_key   = b.month_key
GROUP BY s.product_key;
The fix is to bring both facts to the same grain first, and then combine them. Or keep them separate and let the semantic layer combine them through shared dimensions. That second option is what Kimball calls drilling across, and it's usually the cleaner one.
A dimension that doesn't cover every row in the fact. We had a dimension built at a grain that skipped some combinations that did exist in the facts. Those fact rows had nowhere to point, so they fell out of any visual that used that dimension. Totals looked fine. Breakdowns didn't add up.
The report visual changing the grain. This one surprised me. The table was right, the measure was right, but the visual grouped by a column that made the measure calculate at a different level than the old report did. Same data, different answer, because of how the visual sliced it.
My habit now: whenever a number looks wrong, the first question is "what is the grain of every table and visual involved here?" It solves more than half the issues before I even open the data.
4. Small details in the source data wreck big totals
The bigger bugs were easier to find. The small ones took the longest.
A few examples, kept generic:
- Signs. One source stored credit notes as negative amounts. Another stored them as positive amounts with a "type" flag. If you combine them without making the sign consistent, your totals drift, and only on certain document types, so it's hard to spot.
- Status filters. "Cancelled" means something different in every system. The old report quietly excluded some statuses. The new model included them.
- Dates. Order date, ship date, invoice date, posting date. The old report used one and the new one used another. Both are "the date", until month-end.
- Internal transactions. Sales between divisions of the same company. Some reports include them, some exclude them, and the rule is often not written anywhere.
None of these are modeling problems. They're business rules, and Kimball can't guess them for you. The best place to handle them is once, in the transformation layer, with a clear column name. For example, a signed_amount column next to the raw amount, or an is_internal flag instead of a hidden filter.
5. Multiple source systems: conformed dimensions are harder than they look
Our platform pulls from several source systems. Different ERPs, different eras, different ideas of what a "product" or a "customer" is.
Kimball says: build conformed dimensions so that every fact shares the same customer, product and date. Great idea. Here's what that looks like in real life:
- One system has a customer hierarchy three levels deep. Another has one level.
- Product codes overlap between systems but mean different things.
- One source has history going back years. Another only started recently.
What worked for us:
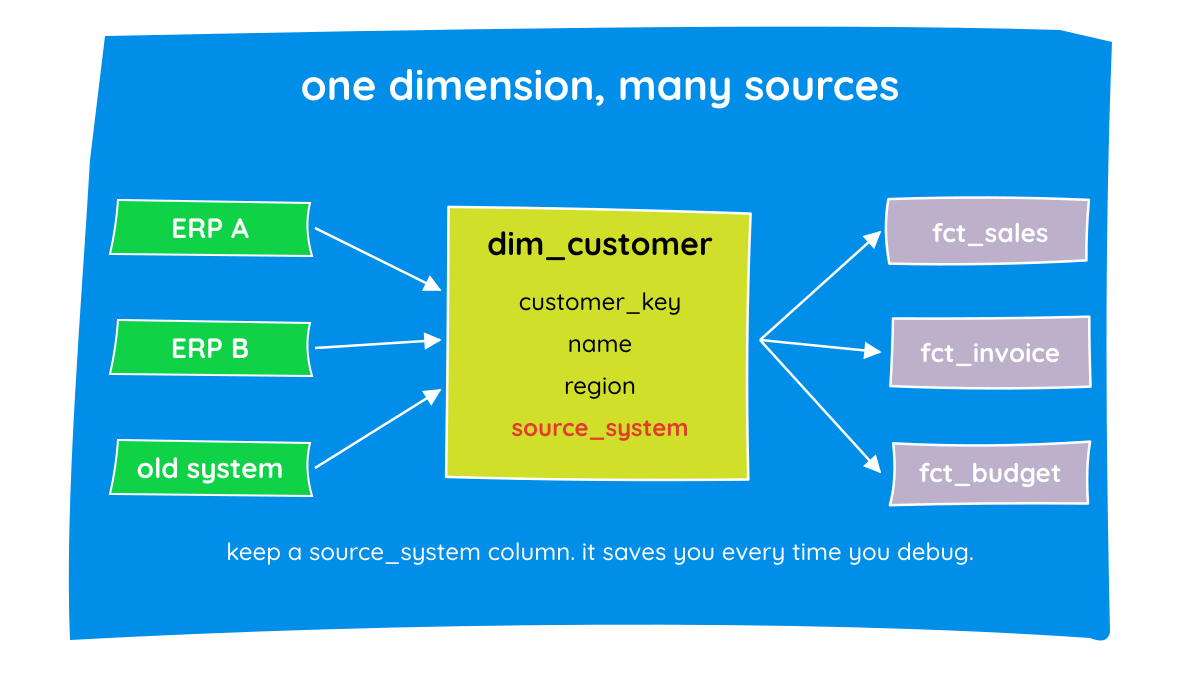
- Keep a source system column on every dimension row. It sounds obvious, but it saves you every time you debug.
- Conform what's truly shared, and don't force the rest. If an attribute only exists in one system, let it be empty for the others. Don't make up values just to fill the column.
- Expect source systems to change. Partway through, one of our sources started being retired and replaced. Because the facts and dimensions were already modeled cleanly, the change was painful but contained. In the old setup it would have meant rewriting dozens of reports.
That last point is honestly the strongest argument for doing Kimball properly. You don't feel the benefit on day one. You feel it the day something upstream changes.
6. Bridge tables and "it depends" relationships
Textbook star schemas are clean: fact in the middle, dimensions around it, one-to-many everywhere.
Real business questions are messier. One order linked to several invoices. One invoice covering several orders. One customer belonging to more than one group.
That's where bridge tables come in, and I used more of them than I expected. Some honest notes:
- They work, but they make filtering behaviour harder to predict. Test with real examples, not just totals.
- Name them clearly. Six months later,
bridge_order_invoiceis far easier to understand thanmap_tbl_2. - Sometimes the simplest answer is a flat, purpose-built table for one specific report. That breaks Kimball purity a little, but if one complex report needs it, it's better than twisting the whole model. I did this once for a page that the star schema just couldn't express cleanly, and it was the right call.
Kimball is a set of good defaults, not a religion.
7. My reconciliation routine (the thing I'd actually reuse)
After doing this for many reports, I settled into a routine. It's boring, and it works.
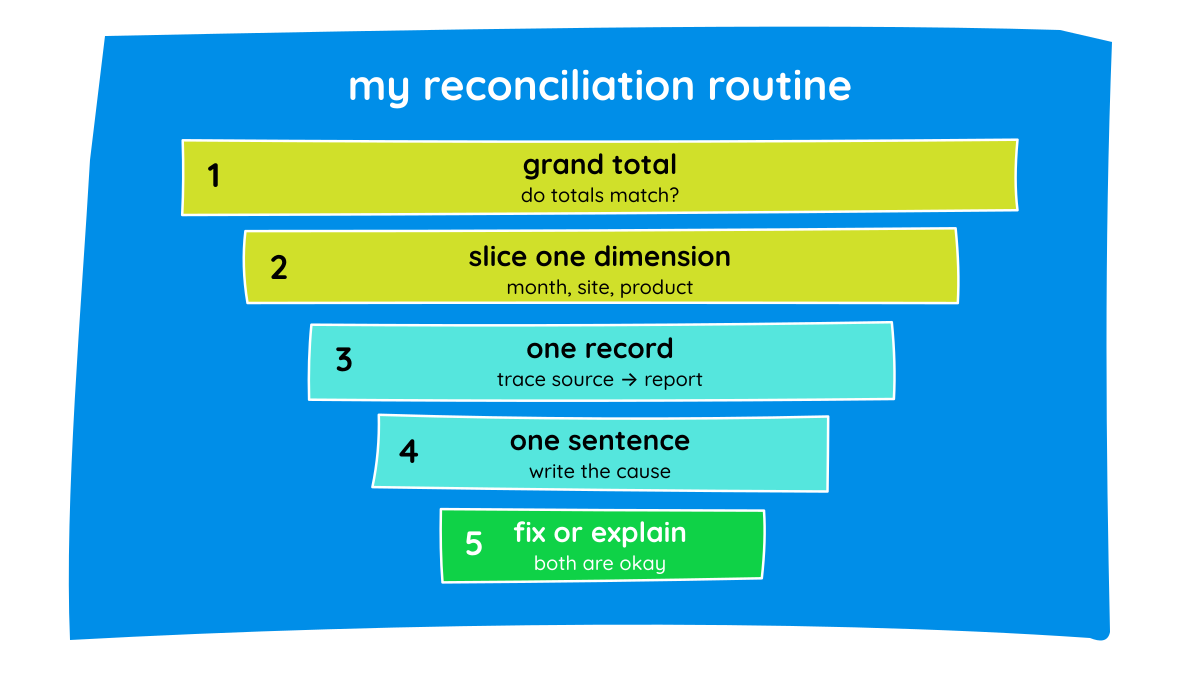
- Start at the grand total. Pick one measure and one period. Do the totals match? If yes, go wider. If no, stop here.
- Slice one dimension at a time. By month, then by site or division, then by product group. Find where the gap lives before asking why.
- Go down to a single record. Pick one order or invoice that's different. Trace it from source to bronze, silver, gold, and then the report.
- Write down the cause in one sentence. "Credit notes from source X have the wrong sign." If you can't say it in one sentence, you haven't found it yet.
- Decide: fix or explain. Some gaps get fixed in the pipeline. Some get documented as expected differences. Both are valid outcomes.
Step 2 is the one people skip, and it's where most of the time is saved. Jumping straight from "total is wrong" to "let me check every row" is how you lose a whole day.
8. Things I'd do differently from day one
If I started this refactor again tomorrow:
- Write down the grain of every fact table as a single sentence, right in the table description. "One row per invoice line per day." No exceptions.
- Catalogue the legacy business rules before building anything. Even a rough spreadsheet would have saved weeks.
- Build a small reconciliation dataset for each report: a handful of known totals the business has signed off on. Then test against that every time something changes.
- Agree on "what counts as matching" with the business before the first comparison, not after the first argument.
- Talk to the people who built the old reports, if they're still around. Ten minutes with them beats ten hours of reverse-engineering.
Wrapping up
Six months in, here's my honest summary.
Kimball dimensional modeling still works, and it works well on a lakehouse. The star schema, conformed dimensions and clear grain made our reports simpler and our platform easier to change.
But the hard part of a refactor isn't the modeling. It's the translation: taking years of undocumented business rules, quirks and exceptions from the old world and making them explicit in the new one. The model gives you a clean place to put that logic. It doesn't find the logic for you.
If you're about to start a similar migration, my one piece of advice is this: respect the grain, and respect the old report, but don't blindly trust either.
I'll try to write more regularly from here. Next, I'm planning a deeper post on that reconciliation routine, with a worked example.
If you've been through something similar, I'd love to hear what surprised you.